GreenPulse robot scanning green at night
1

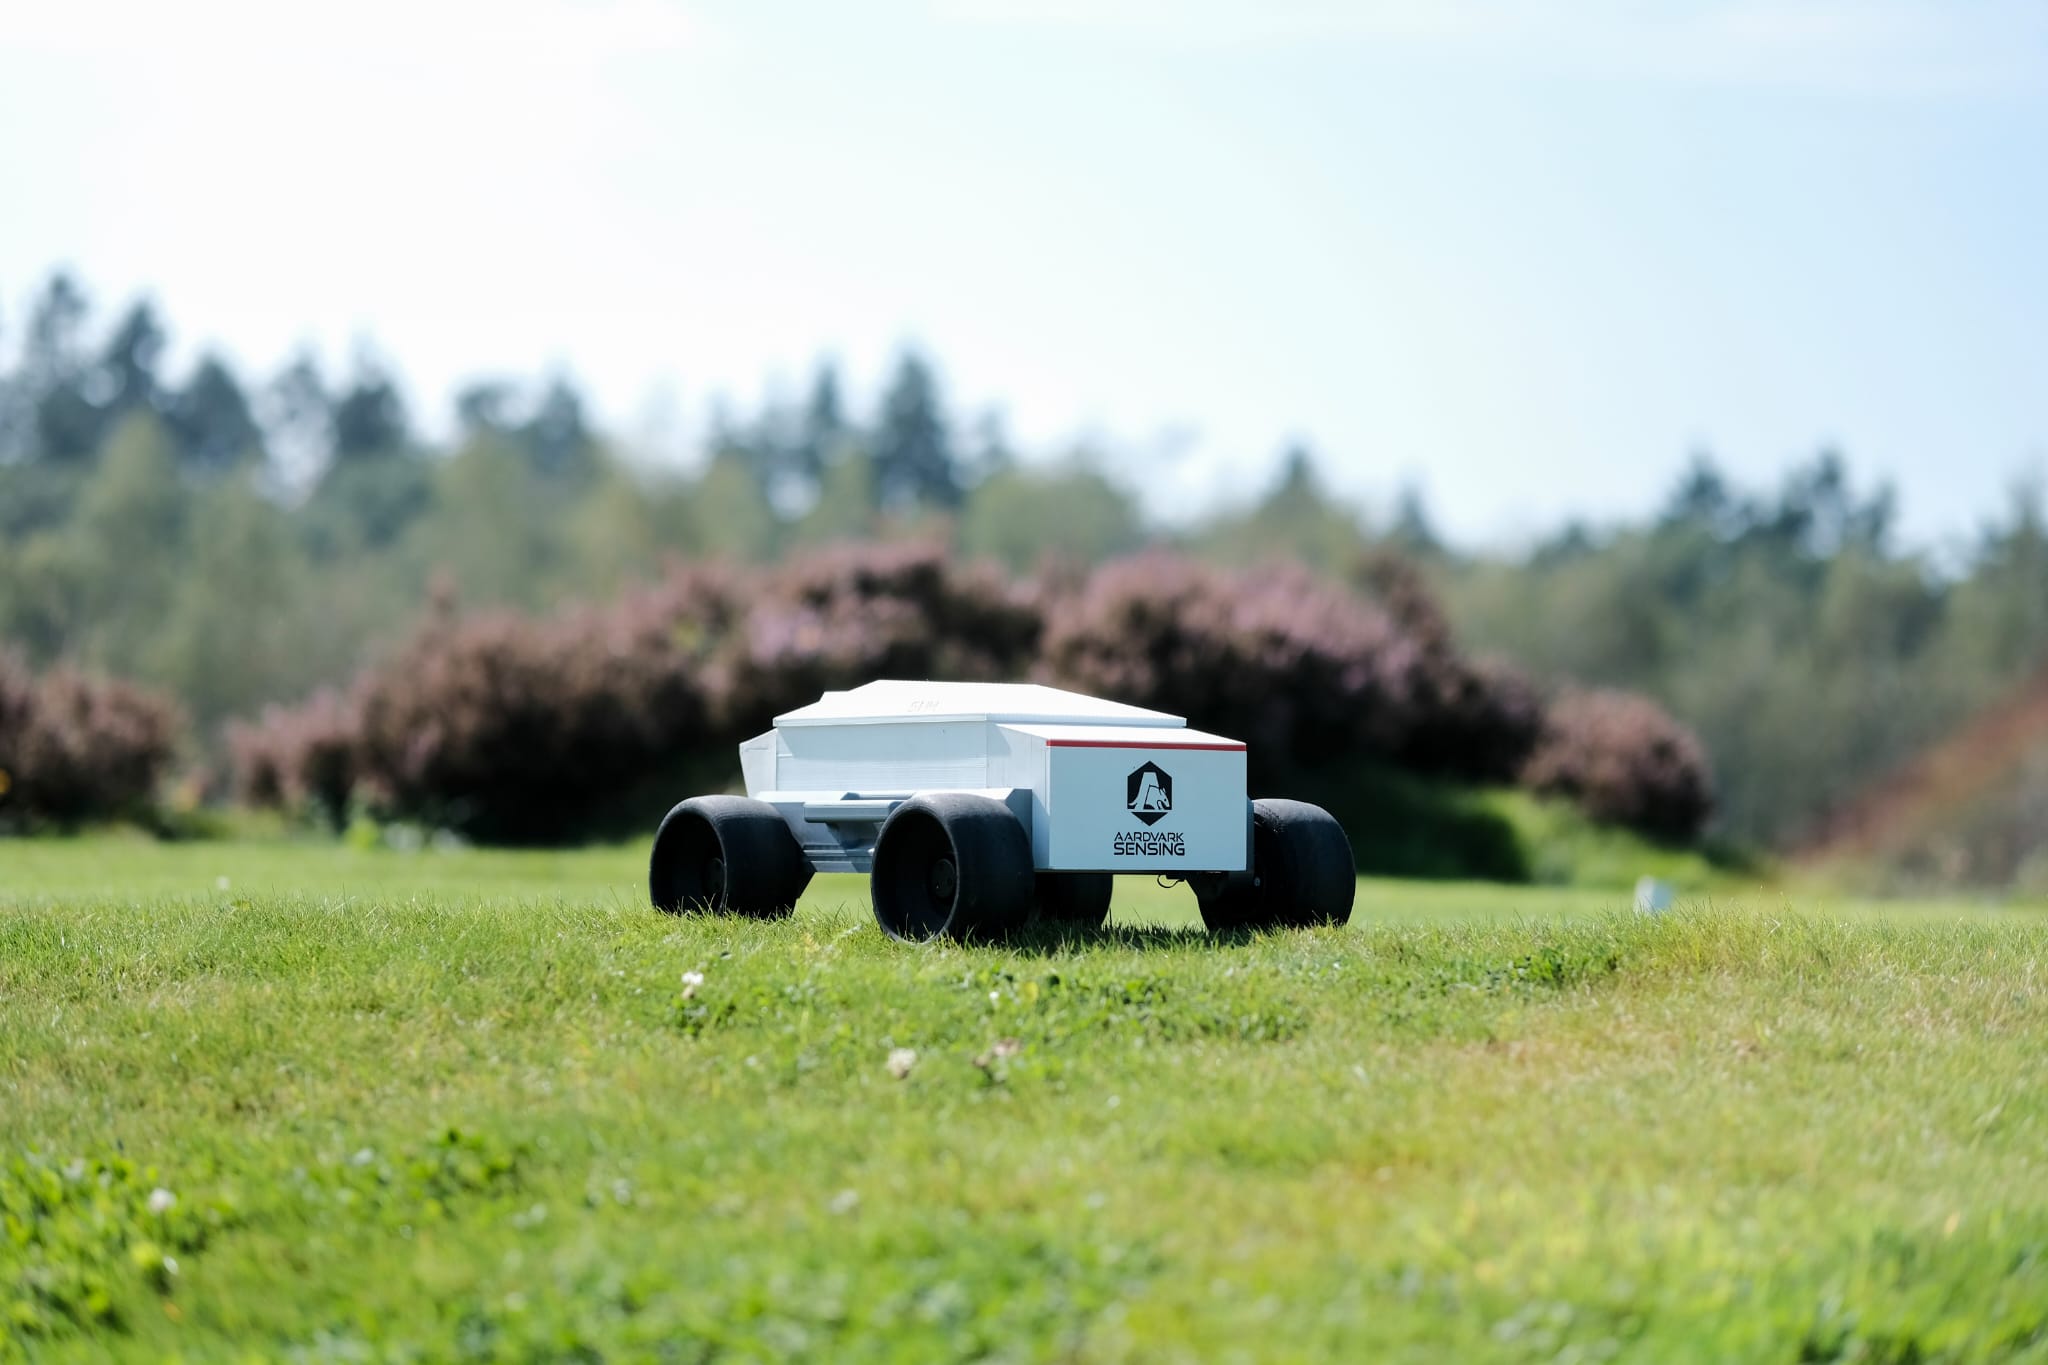
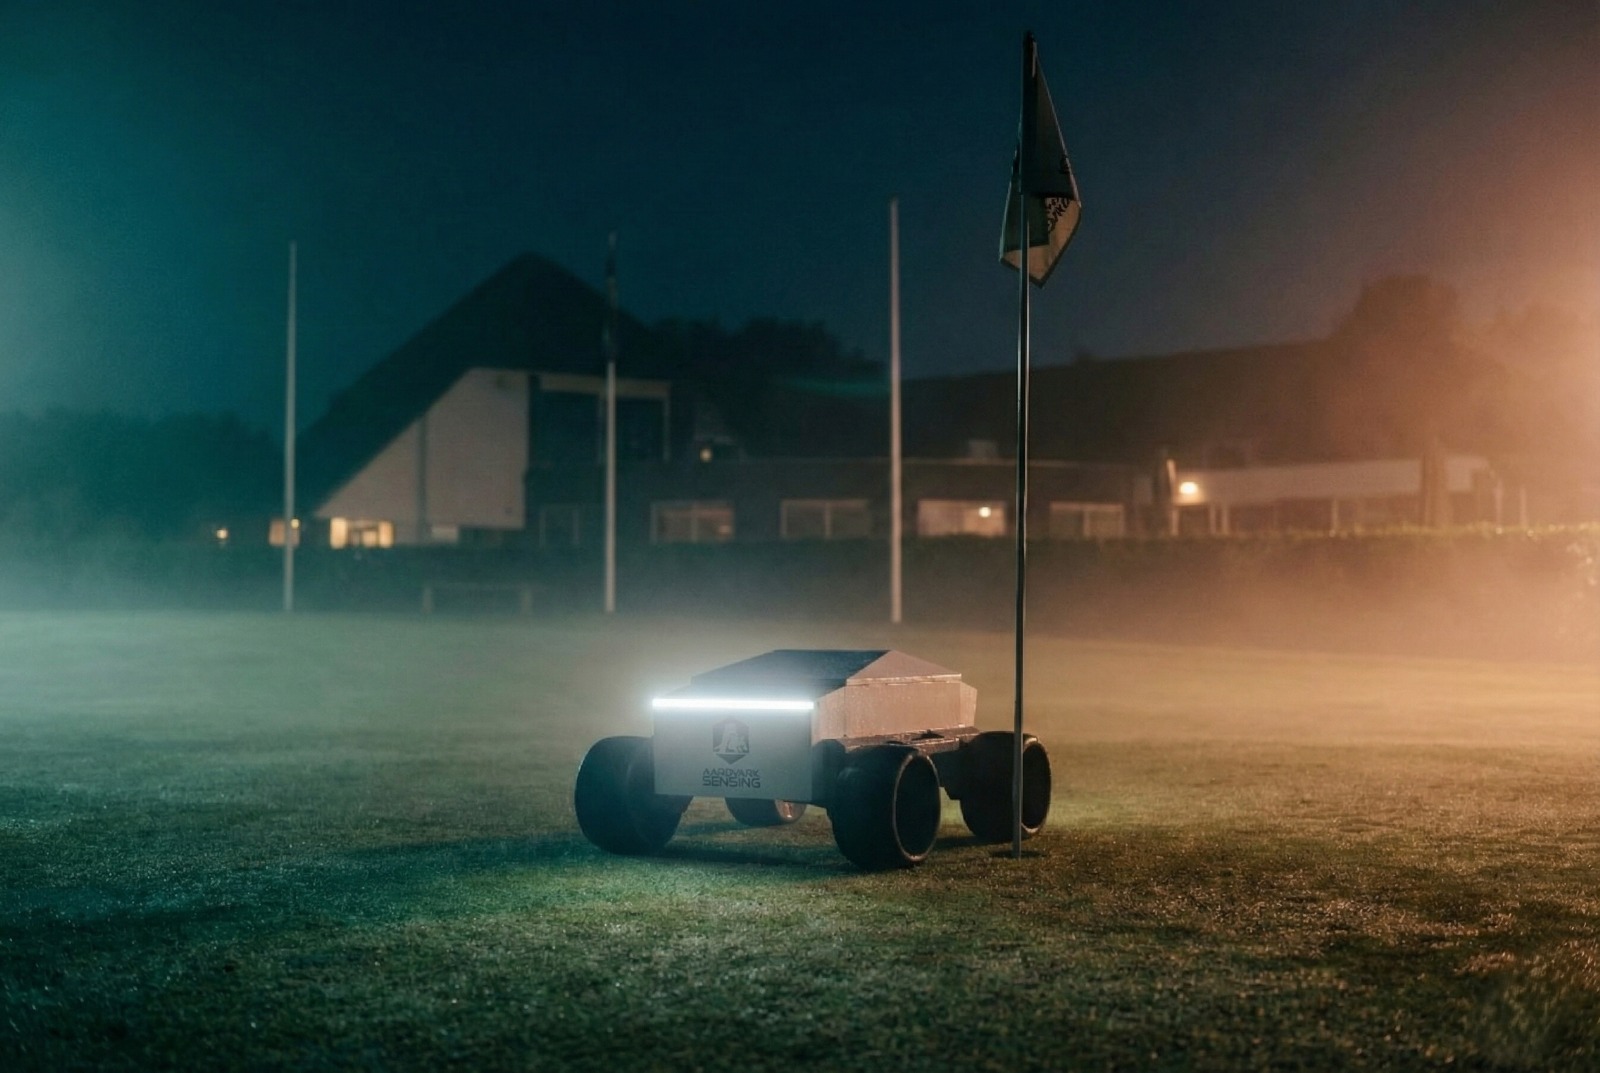
Nightly Autonomous Scanning

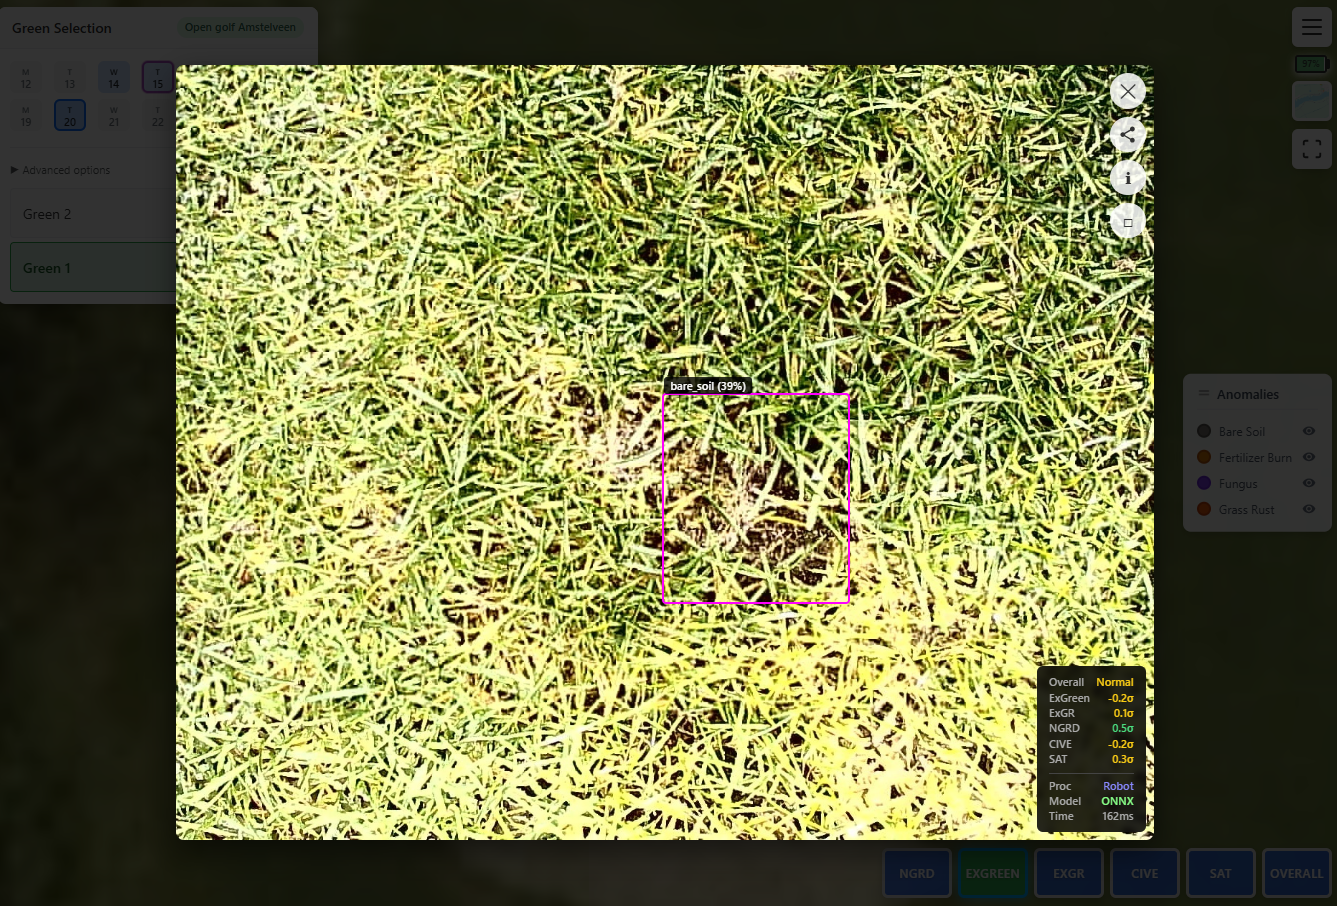
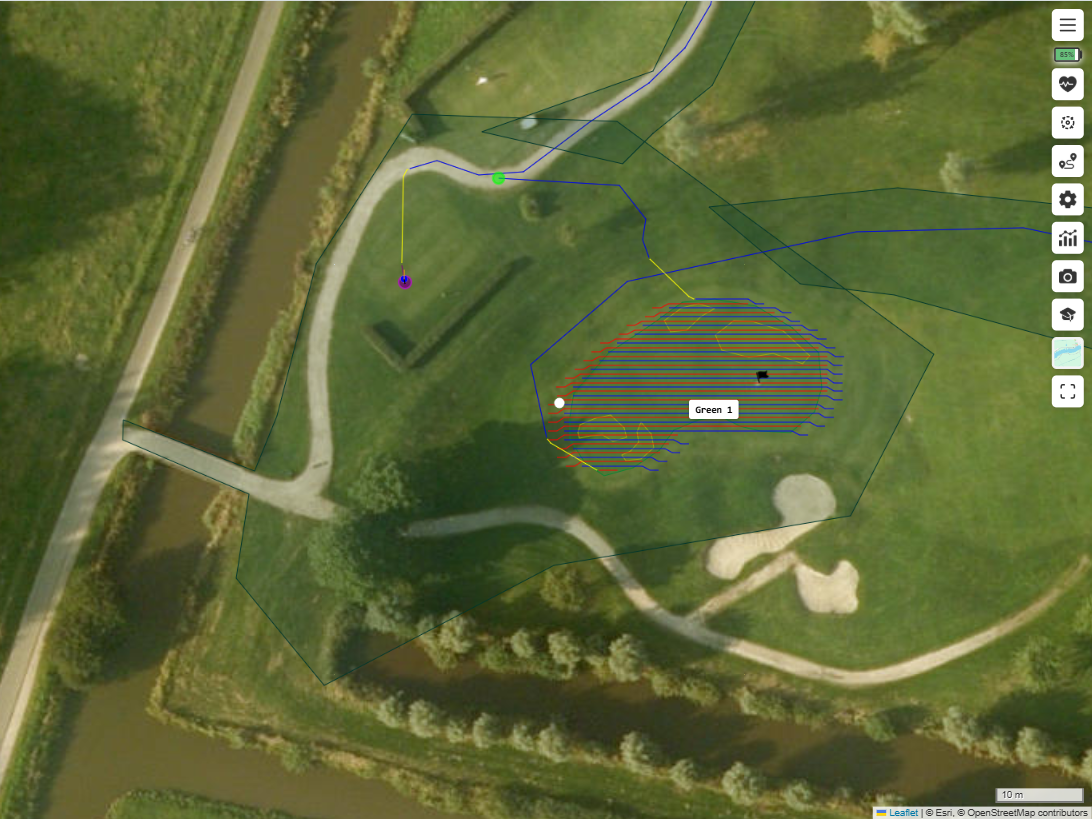
Every night, while your course is quiet, the GreenPulse robot autonomously scans each green. It captures over 4,500 high-resolution multispectral images per green - that's every square centimeter documented.

  • 2-3 greens scanned per hour
  • 10GB of raw multispectral data per green
  • Visual + Near-Infrared imaging
  • Completely independent of sunlight
AI-generated health heatmap
2

AI Analysis in the Cloud

Data is transmitted via dual 4G modems and processed using multiple AI pipelines. The system calculates biometrics, detects anomalies, and identifies early signs of disease before they're visible to the human eye.

Biometrics Calculated

NDVI, chlorophyll content, stress levels, water stress
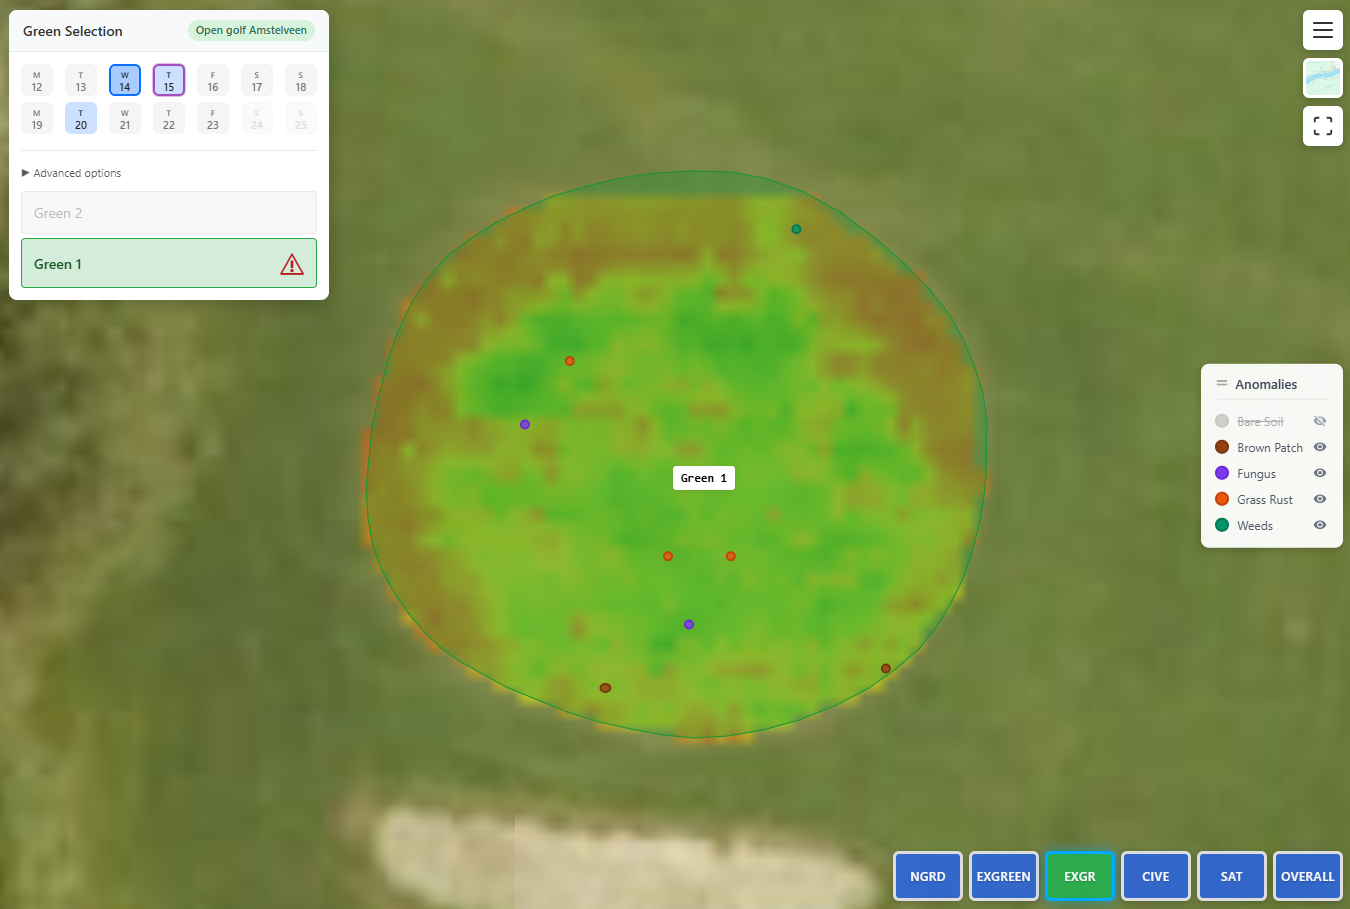
Anomalies Detected

Fungus, weeds, dry patches, nutritional issues
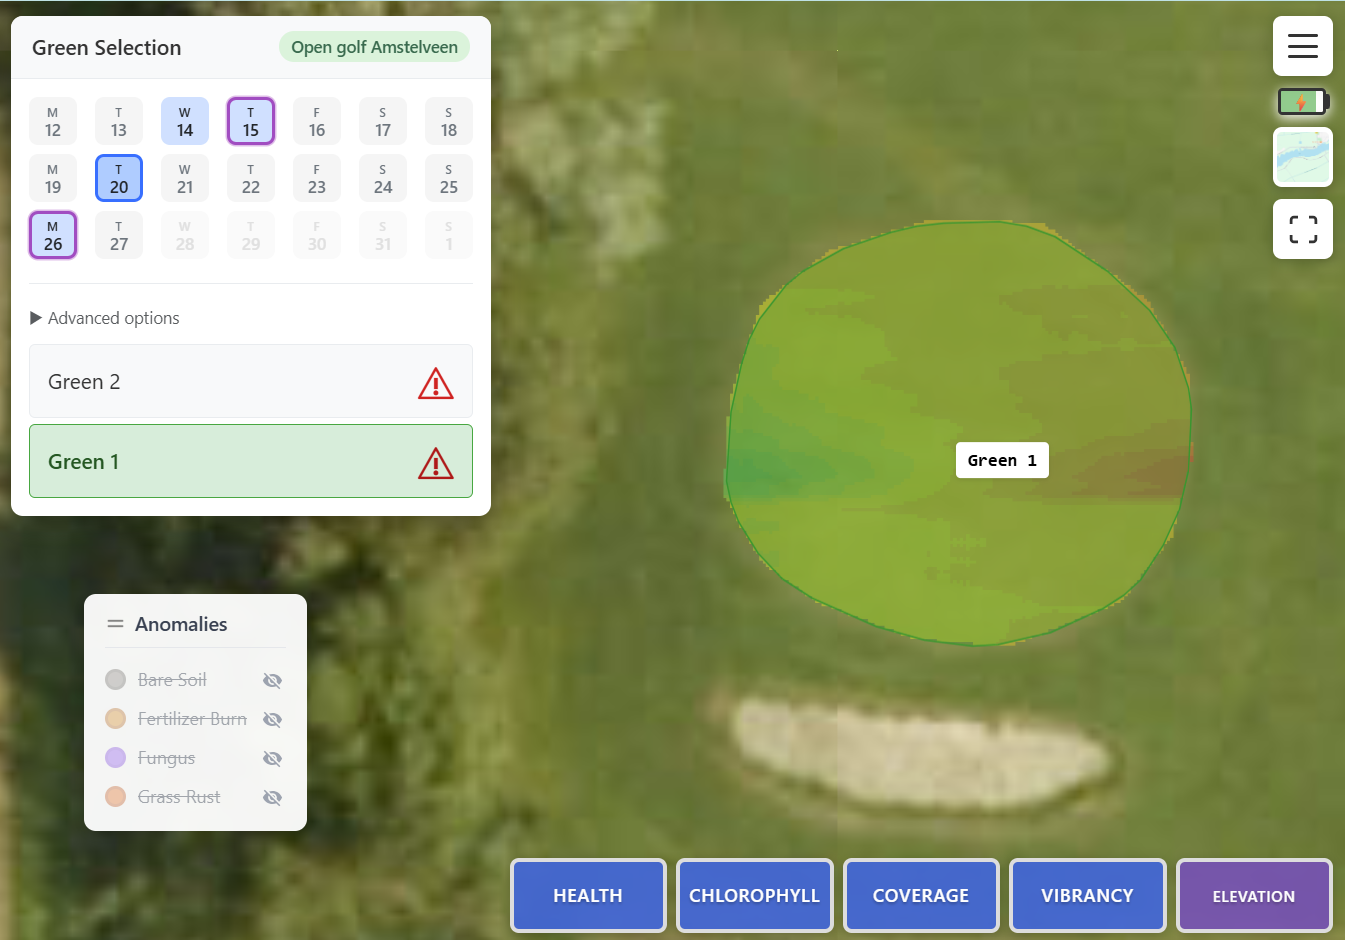
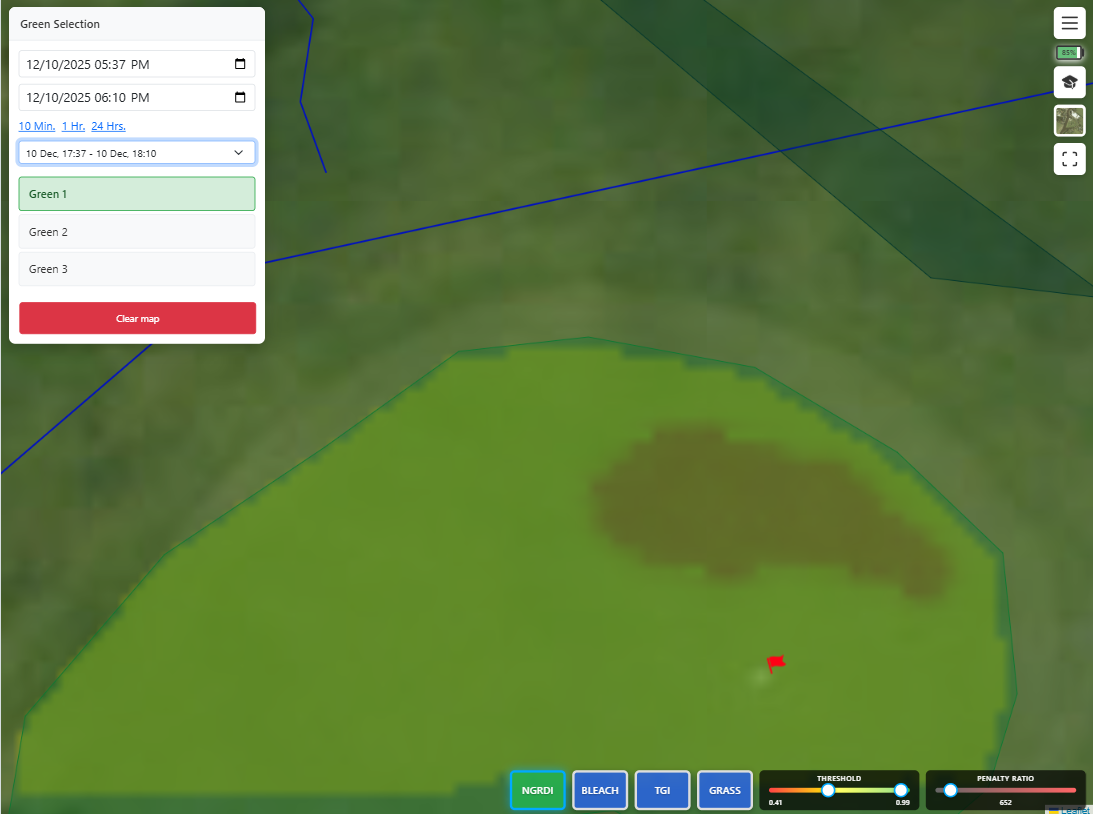
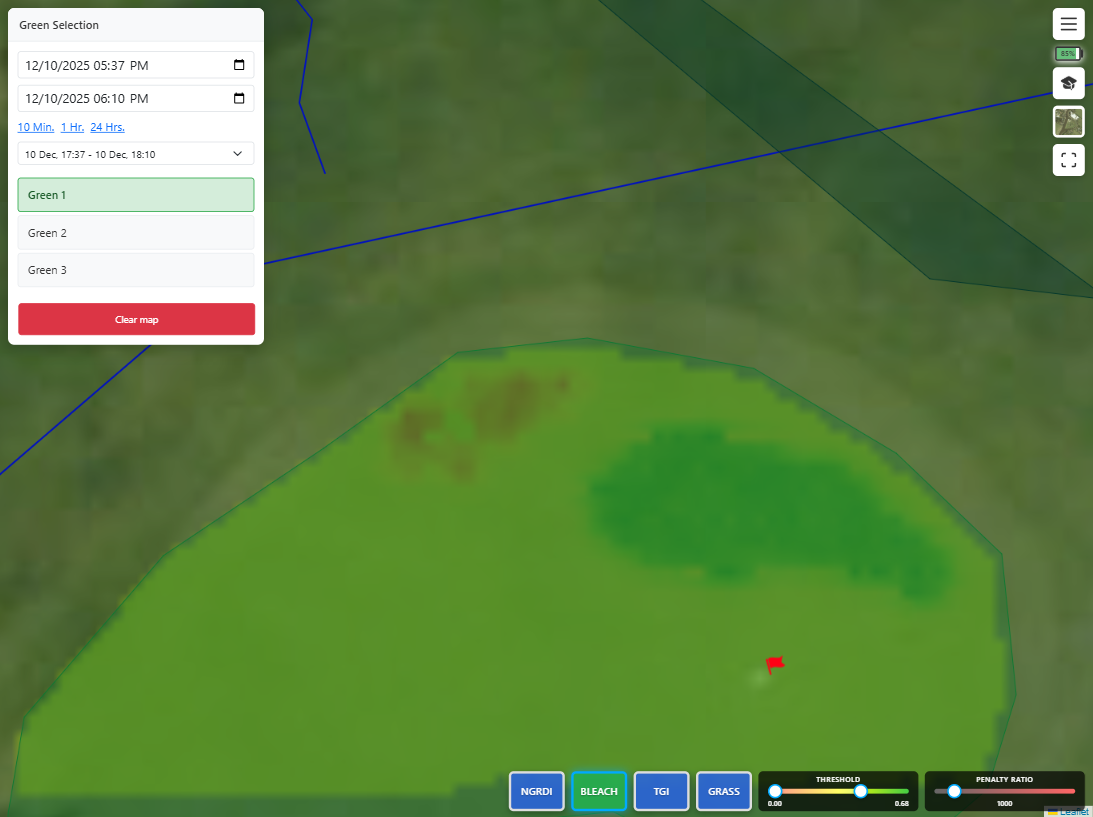
Heatmaps Generated

Visual representation of health across entire green

History Tracked

View same spot up to 14 days back

Morning report showing fungus detection
3

Lead Your Morning Meeting with Data

Before 6am, results are ready on your phone. Arrive informed, give your team clear targeted tasks, and track treatment progress with objective data.

What You See Each Morning:

  • High-priority alerts (fungus risk, disease detection)
  • Medium-priority findings (stress patterns, irrigation issues)
  • Low-priority notes (weed locations, general observations)
  • Heatmaps and images for each affected location

API available for integration with existing course management software.

What We Detect

AI-powered analysis identifies issues before they become visible problems.

Dollar Spot & Fungus

Detection at first appearance - usually during the night when symptoms emerge. You'll know hours before your morning walk would reveal it.

Weed Mapping

Precise GPS locations of weed growth from earliest stages. Classification by type (Poa annua, etc.) and density reports for targeted grooming.

Stress & Drought

Water stress and general plant stress detected through spectral analysis. Identify irrigation coverage gaps before browning appears.

Health Biometrics

NDVI, chlorophyll content, and other vegetation indices calculated for every point. Track trends over time to optimize maintenance.

Anomaly Detection

Statistical deviation from healthy baseline automatically flagged. Spots as small as a few centimeters that deviate in any index.

Historical Comparison

View any location across the past 14 days. Back-trace issues to their earliest appearance. Verify treatment effectiveness.

See the Analysis

Real examples of what our AI detects and reports.

Our neural network identifies and classifies each anomaly with confidence scores. Fungus, weeds, and stress patterns are highlighted directly on the image.

Biometric heatmaps with anomaly markers

Biometric Heatmaps & Anomaly Markers

Switch between vegetation indices to spot stress patterns. Detected anomalies appear as map markers with a legend.

Remote image inspection

Inspect Any Image Remotely

Our classifiers detect anomalies, but you can always check it out for yourself with one tap.

Fully autonomous operation

Fully Autonomous Operation

The robot navigates, avoids obstacles, scans all greens, and returns to charge - while your team sleeps.

3D elevation map

3D Elevation Map

1cm resolution vertical gradient measurement reveals surface undulations and moisture patterns.

The Technology

Purpose-built hardware and software for golf course green monitoring.

Aardvark robot

The Aardvark Robot

1cm Navigation Accuracy

GNSS/RTK/INS combination for precise positioning.

Always Connected

Dual 4G modems ensure reliable data transmission.

Zero Maintenance

No consumables. Over-the-air software updates.

Proprietary Multispectral Sensor

Active illumination for consistent data regardless of conditions.

See GreenPulse on Your Course

Schedule a demo to learn how GreenPulse fits your operation.

Request a Demo